
Group Assignment
| Assessment Details and Submission Guidelines | |
| Trimester | T22025 |
| Unit Code | HI6007(BlockMode2) |
| Unit Title | Statistics for Business Decisions |
| Assessment Type | Group Assignment |
| Weight | 40% |
| Submission Guidelines |
|
| Academic Integrity Information | Holmes Institute is committed to ensuring and upholding academic integrity. All assessments must comply with academic integrity guidelines. Please learn about academic integrity and consult your teachers with any questions. Violating academic integrityisseriousandpunishablebypenaltiesthatrangefromdeductionofmarks, failure of the assessment task or unit involved, suspension of course enrolment, or cancellation of course enrolment. |
| Penalties |
|
Group Assignment Guidelines and Specifications
You are part of the data analytics team at a leading Australian consulting firm. The company serves a diverse client base including public listed companies, small medium sized enterprises (SMEs), and educational institutions. Your team has been assigned to investigate factors influencing property prices in the Australian real estate market to assist stakeholders in making informed business decisions.
How do different factors, such as land size, number of bedrooms, distance to the nearest secondary school, and number of garage spaces, influence the selling price of residential properties?
Your task is to analyze this question using Analysis of Variance (ANOVA) and Correlation Analysis. You must collect real-world data, analyze it using appropriate statistical methods, and interpret your results in a business context.
Create a data set in Excel that meets the following criteria (You are required to upload the data file separately).
Using Excel, generate and present the following statistics for each variable: Mean, Median, Mode, Variance, Standard Deviation, Skewness, Kurtosis, and Coefficient of Variation.
Interpret the values from the descriptive statistics. Discuss the distribution of each variable and identify any interesting patterns, skew ness or out liers that may affect analysis or business decisions.
Useanappropriategraphtovisualisethenumberofbedrooms.Provideabriefexplanationofwhat this distribution indicates.
Create an appropriate graph to illustrate the relationship between land size and selling price. Briefly comment on the relationship.
Use Excel’s ANOVA tool to assess whether the mean selling price differs significantly based on the number of bedrooms.
Produce a correlation matrix for all quantitative variables.
You are part of a consulting group analysing long-term labour market trends in Australia. Your team must apply a mix of statistical tools to evaluate gender-based differences in employment and unemployment types, with a focus on how such data informs workforce planning and policy recommendations.
How have gender-based differences in employment and unemployment patterns evolved in Australia
From 1979 to 2024. What are the statistical and policy implications of these trends?
Task
Note: Refer to the data given in the Excel file “HIM6007T22025GroupAssessment-Dataset”
| Marking criteria | Weighting |
| PARTA(25marks) | |
| Data collection (Excel spreadsheet) | 5marks |
| Descriptive statistical analysis and review(Questions2i–iv) | 8marks |
| ANOVA and Correlation output and interpretation (Questions 3 I and ii) | 12marks |
| PART B (10marks) | |
| Confidence Interval Estimation & Hypothesis Testing (Question i) | 4marks |
| Probability & Socio economic Interpretation (Question ii) | 6marks |
| PARTC(5marks) | |
| Summary (I and ii) | 5marks |
| TOTAL Weight | 40Marks |
Assessment Feedback to the Student: |
| Criterion | Excellent(HD) | Very Good(D) | Good (C) | Satisfactory(P) | Unsatisfactory (F) |
| PARTA–Data Analysis(25Marks) | |||||
1. Data Collection (Excel spreadsheet) (5 marks) | Data is complete, Accurately entered, well-organized and labelled; clearly reflects a strong Understanding of data preparation. | Data is mostly complete and well-organized, with only minor errors or omissions. | Data is generally accurate but may include some formatting or organization issues. | Basic data is included, but errors or lack of structure reduce clarity. | Data is In accurate, incomplete, disorganized, or missing. |
2. Descriptive Statistical Analysis & Review (Questions2 i– iv)(8 marks) | Outstanding Application of Descriptive statistics (mean, median, mode, SD, etc.); Comprehensive review and accurate interpretation of all measures. | Very good application and interpretation with only minor misinterpretations. | Good analysis with adequate statistical measures and generally correct interpretation. | Basic understanding shown; some correct statistics but interpretation is limited. | Poor or incorrect Use of statistics; no meaningful interpretation. |
3.ANOVAand Correlation Output & Interpretation (Questions 3 I & ii)(12marks) | Demonstrates deep Understanding of both ANOVA and Correlation analysis; accurate output, insightful and correct interpretation of relationships. | Very good Understanding with mostly accurate output and interpretation; minor gaps. | Good understanding with correct output but limited interpretation or minor errors. | Basic interpretation: output may contain errors or misinterpretations. | Poor or incorrect output; no understanding of statistical meaning or relationships. |
| PARTB–Statistic alI nference (10Marks) | |||||
4. Confidence Interval Estimation & Hypothesis Testing (Question i)(4 marks) | Excellent Understanding and execution of CI and hypo thesis testing; correct values and insightful interpretation in context. | Very good use of Methods with Correct calculation and mostly clear interpretation. | Good attempt With some Correct results and partial interpretation. | Basic attempt made; multiple errors in method or interpretation. | In corrector missing calculation; misunderstanding of statistical inference. |
5.Probability& Socioeconomic Interpretation (Question ii)(6 marks) | Accurate and well- Reasoned probability analysis; strong Link age to Socio economic context with clear insight. | Very good probability estimation and generally relevant interpretation. | Good attempt; minor issues with calculations or socio economic relevance. | Basic probability analysis; interpretation may be vague or underdeveloped. | Incorrect probability approach or weak/irrelevant interpretation. |
| PARTC–Summary(5Marks) | |||||
6.Summaryof Findings (Questions i & ii) (5 marks) | Clear, comprehensive, and well-structured summary; all major findings effectively synthesized and linked to research questions. | Summary covers Key findings with minor omissions or less clarity. | Adequate Summary with relevant points, though some findings maybe unclear. | Basic summary; Limited insight or connection to research questions. | Summary is incomplete, unclear, or fails to reflect findings. |
Your final submission is due Friday of week ten before midnight.
The following penalties will apply:
Holmes has implement da revised Harvard approach to referencing. The following rules apply:
The reference list must include the details of all the in-text citations, arranged A-Z alphabetically by author's surname with each reference numbered (1to10, etc.) and each reference MUST include a hyperlink to the full text of the cited reference source.
For example:
Hawking, P., McCarthy, B. & Stein, A. 2004. Second Wave ERP Education, Journal of Information Systems Education, Fall, http://jise.org/Volume15/n3/JISEv15n3p327.pdf
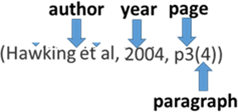
All assignments must include in-text citations to the listed references. These must include the surname of the author/s or name of the authoring body, year of publication, page number of the content, and paragraph where the content can be found. For example, "The company decided to implement an enterprise-wide data warehouse business intelligence
Strategy (Hawkingetal., 2004, p3(4))."
Where students do not follow the above rules, penalties apply:

Get original papers written according to your instructions and save time for what matters most.